Figure 4.
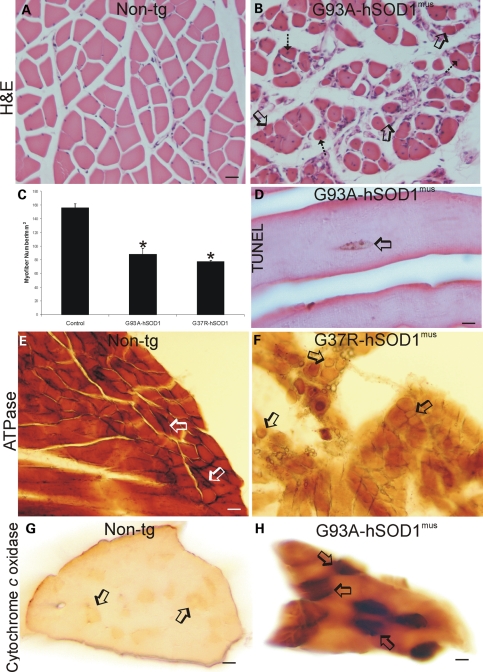
hSOD1mus tg mice develop severe myopathy and myofiber cell death. (A) Transverse H&E-stained sections of gastrocnemius in 12-month-old non-tg mice show that myofibers are stained homogeneously with eosin and have peripherally located hematoxylin (blue)-stained nuclei. The individual myofibers are plump and polygonal or triangular. (B) Transverse H&E-stained sections of gastrocnemius in age-matched hSOD1mus tg mice (G93A, line 98 is shown) have degenerating skeletal muscle. The myofibers are round and shrunk (open arrows) or are irregular in shape and have centrally located nuclei (hatched arrow). Loose, irregularly arranged connective tissue infiltrates into the skeletal muscle. Scale bar (A and B): 47.5 μm. (C) The graph of gastrocnemius myofiber counts in 10–15-month-old non-tg and mutant hSOD1mus tg mice (different lines for each construct are grouped) as determined from transverse H&E-stained sections. Values are mean ± SEM. Asterisk indicates significant difference (P < 0.05) from control. (D) TUNEL revealed myofiber nuclear DNA fragmentation (brown nucleus, open arrow), indicating cell death, in hSOD1mus tg mice (line 98 is shown). Scale bar: 16 μm. (E and F) Enzyme histochemical staining for myofiber ATPase in non-tg mice skeletal muscle (biceps) revealed a pattern of darkly stained type-1 fibers (open arrows) and more moderately stained type-2 fibers (E), whereas ATPase staining of hSOD1mus tg mouse skeletal muscle (line 25 is shown) revealed a loss of type-1 fiber staining and the presence of grouped atrophy (arrows). Sections shown from different mice were incubated at the same time under identical conditions. Scale bar (E and F): 34 μm. (G and H) Enzyme histochemical staining for Cox activity (brown labeling) in transverse sections of gastrocnemius muscle of age-matched non-tg mice and hSOD1mus tg mice (line 112 is shown) revealed differences in mitochondrial oxidative metabolism. In 12–15-month-old non-tg mouse skeletal muscle, some myofibers (arrows) stain more darkly than the myofiber majority, whereas in hSOD1mus tg mice (line 112 is shown), most myofibers stain more darkly than control, and a subset of myofibers shows very high enzyme activity (H, arrows). Sections shown from different mice were incubated at the same time under identical conditions. Scale bars: 44 μm (G); 22 μm (H).

