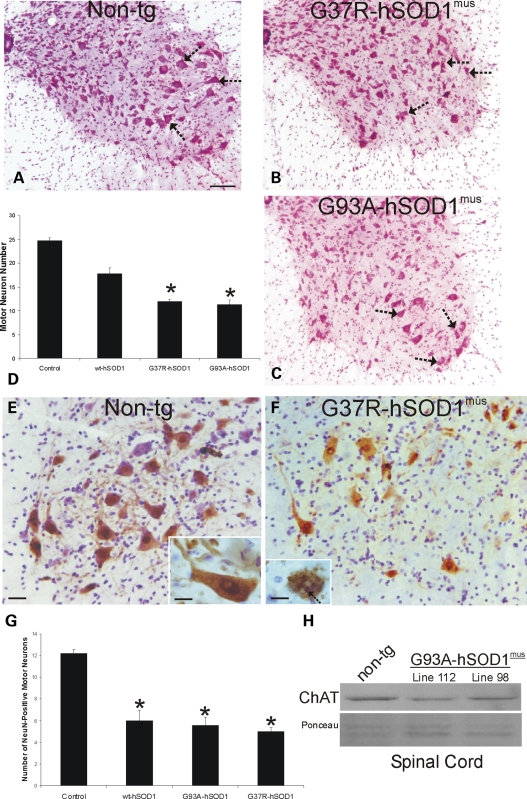
Figure 7.
hSOD1mus tg mice expressing mutant variants have loss of spinal MNs at ∼1 year of age. (A–C) Images of lumbar spinal cord sections stained with CV (hemisections are shown) representative of non-tg (A) and hSOD1mus tg mice expressing G37R (B, line 25) and G93A (C, line 112) mutants. Depletion of some MNs (arrows) is evident in G37R and G93A mice. Scale bar (A–C): 100 μm. (D) Graph of lumbar MN numbers in control non-tg mice and hSOD1mus tg mice expressing wild-type and mutant hSOD1 (different lines for each construct are grouped). Values are mean ± SEM. G37R and G93A mice have a significant loss (P < 0.05) of MNs. (E) Immunohistochemistry shows that large multipolar α-MNs in the ventral horn of non-tg mice are positive for the DNA-binding protein NeuN (brown cells). Sections were counterstained with CV. NeuN is present in the nucleus and cytoplasm of mouse MNs (inset) Scale bar (E and F): 32 μm; inset: 15 μm. (F) NeuN-positive α-MNs were depleted in ventral horn of hSOD1mus tg mice (line 25 is shown). Attritional α-MNs in mutant hSOD1mus tg mice (line 25 is shown) have apoptotic changes such as fragmentation of the NeuN-positive nucleus into smaller round masses (inset, arrow). Scale bar inset: 15 μm. Sections were counterstained with CV. (G) Graph of lumbar NeuN-positive α-MN numbers in control non-tg mice and hSOD1mus tg mice expressing wild-type and mutant hSOD1 (different lines for each construct are grouped). Values are mean ± SEM. G37R, G93A and wild-type hSOD1mus tg mice have a significant loss (P < 0.05) of α-MNs. (H) Western blot for the MN neurotransmitter-synthesizing enzyme ChAT in soluble protein extracts of total spinal cord from age-matched (12–15 months) non-tg mice and hSOD1mus tg mice expressing G93A variant (lines 112 and 98). Equivalent protein loading is shown by the Ponceau S-stained membrane.

