Figure 9.
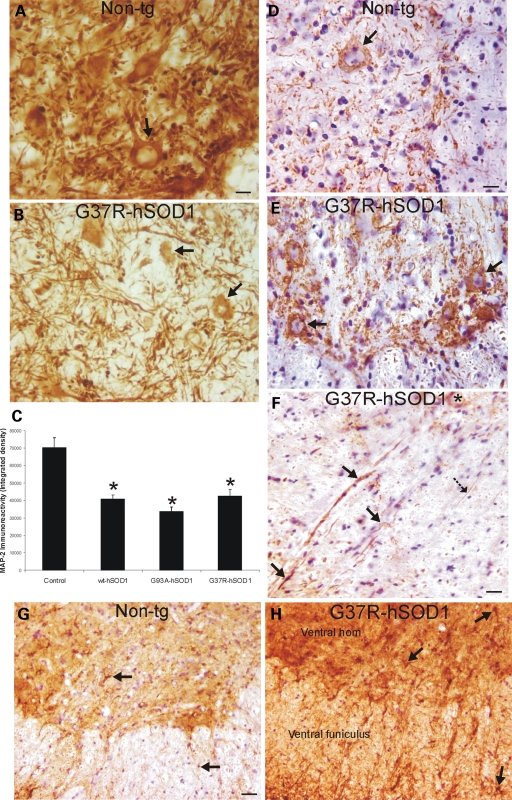
hSOD1mus tg mice have cytoskeletal abnormalities consistent with spinal MN degeneration. (A and B) Immunohistochemistry shows that the somatodendritic cytoskeletal protein MAP2 is enriched (brown staining) in individual spinal MNs (A, arrow) and is very concentrated in the neuropil of non-tg mice, whereas it is depleted in the ventral horn of hSOD1mus tg mice (line 85), and individual MAP2-positive MNs are attritional and without major proximal dendrites (B, arrows). Scale bar (A and B): 26 μm. (C) Graph of total MAP2 immunoreactivity, determined by densitometry, in lumbar spinal cord ventral horn in age-matched control non-tg mice and hSOD1mus tg mice expressing wild-type and mutant hSOD1 (different lines for each construct are grouped). Values are mean ± SEM. Tg mice have significantly (asterisks, P < 0.05) decreased MAP2 immunoreactivity in ventral horn. (D and E) In spinal cord sections stained immunohistochemically for phosphorylated neurofilament (using immunoperoxidase with DAB, brown staining), there was only faint labeling in the MN cell bodies in controls (D), whereas age-matched mutant-hSOD1mus tg mice (line 85) showed prominent accumulation of phosphorylated neurofilament in cell body of MNs (E, arrows). Sections were counterstained with CV. Scale bar (D and E): 26 μm. (F) Within white matter near the ventral root exit zone of mutant-hSOD1mus tg mice (line 25), subsets of axons positive for phosphorylated neurofilament (brown staining) were dystrophic, appearing as swollen or tortuous (arrows), whereas other axons appeared normal as uniform, fine filaments (hatched solid black arrow). A ventral horn MN has accumulated phosphorylated neurofilament in the cell body (asterisk). Section was counterstained with CV. Scale bar: 24 μm. (G and H) In lumbar spinal cord sections stained immunohistochemically for GFAP (using immunoperoxidase with DAB, brown staining), controls had low immunoreactivity, and individual astrocytes in gray matter and white matter were small and non-reactive (G, arrows); in contrast, mutant-hSOD1mus tg mice (line 73) showed dark immunoreactivity (H), compared with age-matched control (G), indicative of reactive astrogliosis. Individual astrocytes in mutant-hSOD1mus tg mouse spinal cord were large and reactive (H, arrows). Sections were counterstained with CV. Scale bar (G and H): 68 μm.

