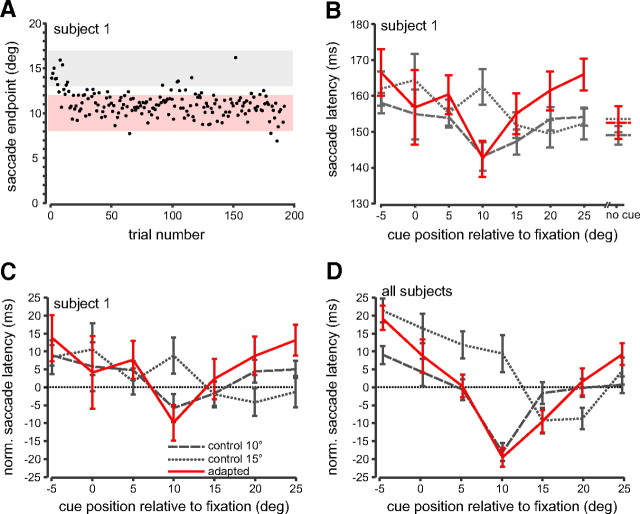
Figure 3.
Saccade adaptation trials. A, Saccade amplitude as a function of trial number for the 15° to 10° adaptation block from subject 1. Same format as in Figure 2 A. The pink region demarcates the range of saccade amplitudes that were included in the analysis (adapted saccades; ±2° of the second target position). The gray region demarcates the range of saccade amplitudes that were included in Figure 5 (unadapted saccades; ±2° of the first target position). B, Average adapted saccade latencies for each flashed cue position for the 15° to 10° adapted saccade condition (red line) for subject 1. For comparison, the 10° (dashed gray line) and 15° (dotted gray line) control saccade conditions are replotted from Figure 2 C. Error bars are SEM. C, Saccade latencies from B are shown normalized to the mean of the no-cue trials within each control and adapted saccade condition. See also supplemental Figure 1 (available at www.jneurosci.org as supplemental material). D, Normalized average adapted saccade latencies across all subjects for the 15° to 10° adapted saccade condition (red line) plotted with the 10° (dashed gray line) and 15° control conditions (dotted gray line).

