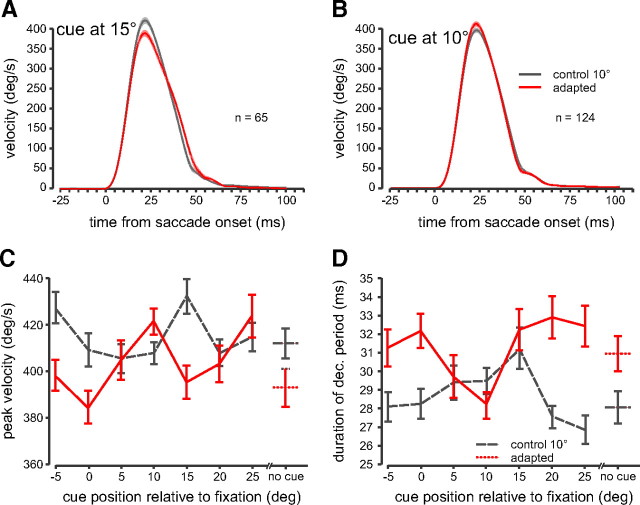
Figure 6.
Saccade dynamics. A, Average eye velocity profiles are shown for the adapted (red traces + SEM, shaded regions) and the 10° control (gray traces) conditions when the cue was presented at 15° (visual target location). Saccades are aligned at saccade onset. B, Average velocity profiles when the cue was presented at 10° (saccade goal location). C, Peak velocity as a function of cue position. D, Duration of the deceleration period of the saccade (peak velocity to saccade end) as a function of cue position. Error bars are SEM.

