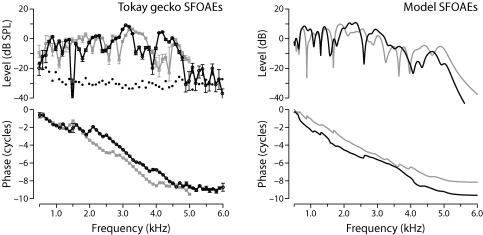
Figure 2.
Measured and model stimulus-frequency OAEs. Panel A: Representative SFOAEs at probe levels of 20 dB SPL in the tokay gecko (G. gecko) from the study of Bergevin et al. (2008). Black and gray lines show data from two different geckos. Error bars on the data points give the standard error of the mean (35 measurements at each frequency in each gecko). The dotted line shows the acoustic noise floor. Panel B: Simulated SFOAEs ΔP computed from Eq. 8 using random micromechanical irregularities and the parameter values given in Table 1. The emission magnitudes have been scaled up by 45 dB to approximate those of the measurements (see text). Black and gray lines show model results for two different “ears” (i.e., different irregularity patterns).

