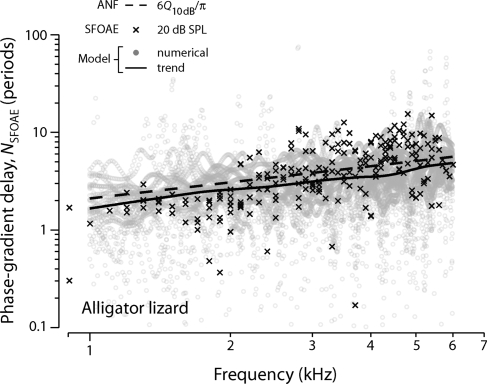
Figure 4.
Measured and model SFOAE phase-gradient delays NSFOAE versus frequency in alligator lizard. The format is the same as Fig. 3. The symbol × shows delays in stimulus periods measured at a probe level of 20 dB SPL (six ears) using methods described elsewhere (Bergevin et al., 2008). Data points within 10 dB of the noise floor are not shown. The gray dots show model NSFOAE values obtained from numerical simulations of 25 different irregularity patterns. The solid curve is a loess trend line fit to the model results. The dashed line gives the analytic approximation 6Q10 dB∕π [Eq. 14], where Q10 dB(CF) is a power-law fit to ANF data (Weiss et al., 1976). Data are taken the study of Bergevin et al. (2010).

