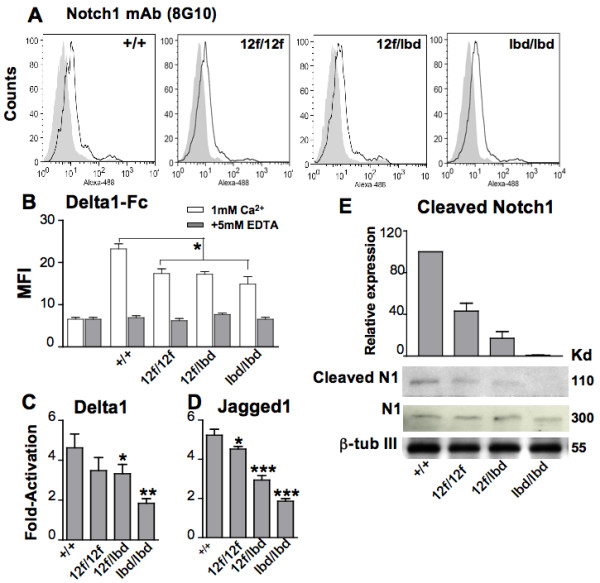
Figure 2.

A graded reduction in Notch1 signaling in Notch112f/lbd ES cells. (A) Notch1 expression on the surface of ES cells (Notch1+/+, Notch112f/12f, Notch112f/lbd and Notch1lbd/lbd) was analyzed by flow cytometry using anti-Notch1 mAb 8G10 (solid line). Shaded profiles are secondary Ab only. (B) Delta1-Fc binding to ES cells. Control is secondary antibody alone. 5 mM EDTA inhibited ligand binding to control levels (gray). Data are mean ± SEM (n = 4), * p < 0.05 between Notch1+/+ and all mutant lines. (C) Delta1-induced Notch signaling and (D) Jagged1-induced Notch1 signaling were determined by co-culturing ES cells with Delta1/L or Jagged1/L cells compared to control L cells after transfection of a Notch reporter construct. Bars represent fold-activation ± SEM (n = 4), * p < 0.05; ** p < 0.01, *** p < 0.001 based on the two-tailed Student's t test; (E) Whole cell lysates from ES cells were subjected to western analysis using the Val1744 antibody for activated Notch1 and the 8G10 antibody for full length Notch1. The histogram shows the relative expression of activated Notch1 after normalization to β-tubulin III (mean ± SEM from 4 experiments).
