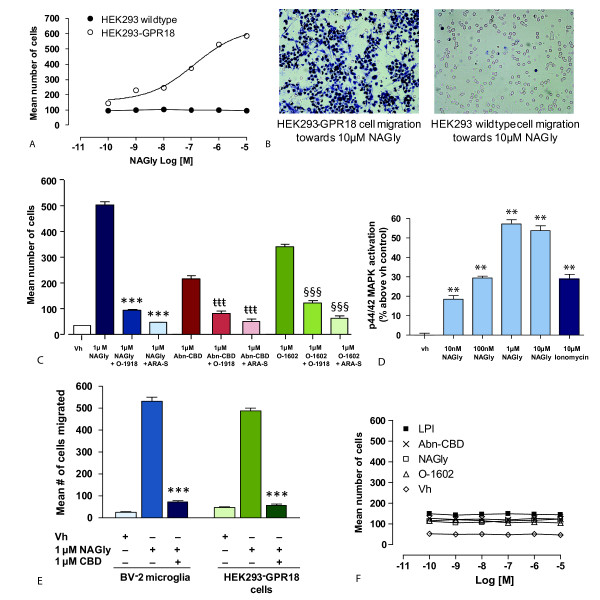
Figure 7.
NAGly-induced migration of HEK293-GPR18 and HEK293-GPR55 cells. (A) HEK293 wildtype and HEK293-GPR18 transfected cell migration in response to 0.1 nM - 10 μM NAGly; n = 3. (B) Filter photographs of one random field of view at ×40 magnification indicating the migration produced by 10 μM concentrations of NAGly in HEK293-GPR18 and HEK293 wildtype cells. The 10 μm diameter pores can be discerned as the clear unstained circles. (C) HEK293-GPR18 cell migration in response to Vh (0.1% DMSO); 1 μM NAGly; 1 μM NAGly ± 1 μM O-1918; 1 μM NAGly ± 1 μM ARA-S. *** = P < 0.001 compared to 1 μM NAGly; one-way ANOVA; n = 3. HEK293-GPR18 cell migration in response to 1 μM Abn-CBD; 1 μM Abn-CBD ± 1 μM O-1918; 1 μM Abn-CBD ± 1 μM ARA-S; ttt = P < 0.001 compared to 1 μM Abn-CBD; n = 3. HEK293-GPR18 cell migration in response to 1 μM O-1602; 1 μM O-1602 ± 1 μM O-1918; 1 μM O-1602 ± 1 μM ARA-S. §§§ = P < 0.001 compared to 1 μM O-1602; one-way ANOVA; n = 3. (D) BV-2 microglia and HEK293-GPR18 cell migration in response to Vh (0.1% DMSO); 1 μM NAGly; 1 μM NAGly = 1 μM CBD; *** = P < 0.001 compared to 1 μM NAGly; one-way ANOVA; n = 3. (E) p44/42 MAPK activation in HEK293-GPR18 cells in response to vh (0.1% DMSO) for 3 hours; 10 nM - 10 μM NAGly for 3 hours; 10 μM Ionomycin for 5 min. ** = P < 0.01 compared to vh; one-way ANOVA; n = 3. (F) HEK293-GPR55 cell migration in response to 0.1 nM - 10 μM concentrations of LPI, Abn-CBD, NAGly, O-1602 and Vh (0.1% DMSO); n = 3.

