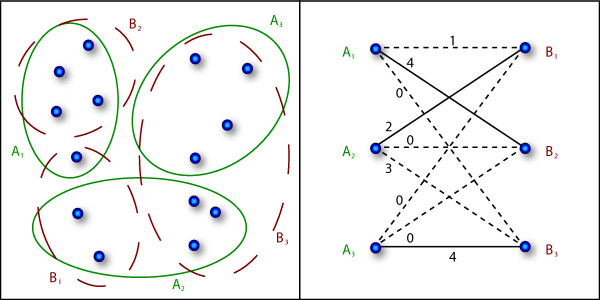
Figure 3.
Example for cluster evaluation via the MCA index. On the left, two possible partitionings of the data set are shown, i. e. P = {A1, A2, A3} and Q = {B1, B2, B3}. The bipartite matching graph is given on the right. Each edge is annotated with the number of intersecting data points in both partitionings. The solid lines mark the maximal matching edges. In this example the MCA index is  = 0.71.

