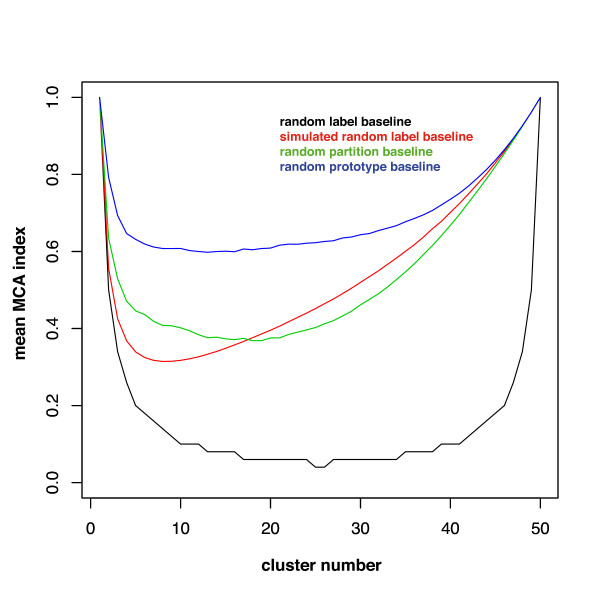
Figure 4.
Comparing different baseline distributions for clustering. Baselines for clustering an artificial data set containing 50 one-dimensional points. For each partitioning into k = {1, ..., 50} clusters, the average value of the MCA index from 500 runs is plotted. The different baselines are from bottom to top: black = random label, red = simulated random label, green = random partition, blue = random prototype. It can be seen that the random label baseline is a lower bound for the MCA index, whereas the simulated random label and random partition baselines are much tighter. The data-driven random prototype baseline builds the tightest bound for the MCA index.

