
Figure 8.
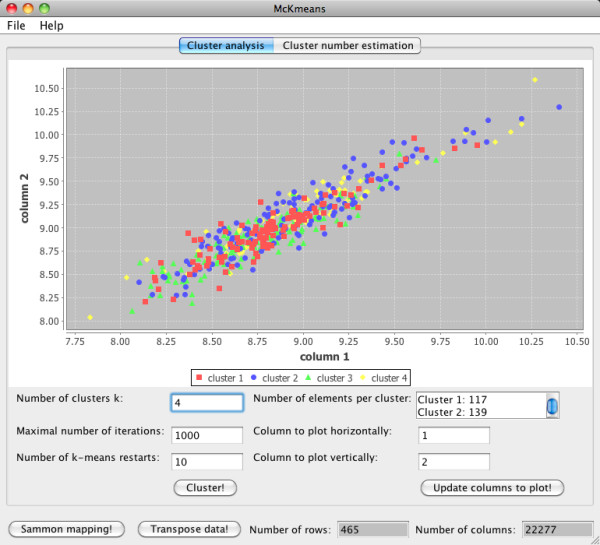
Graphical user interface. The GUI supports clustering of microarray (real valued) and SNP data. Clustering subjects and clustering genes/SNPs can be done by transposing the imported data set. Gene data can be visualized as a scatterplot from two selected dimensions and via a Sammon mapping. Cluster number estimations can also be visualized (see Figure 7).