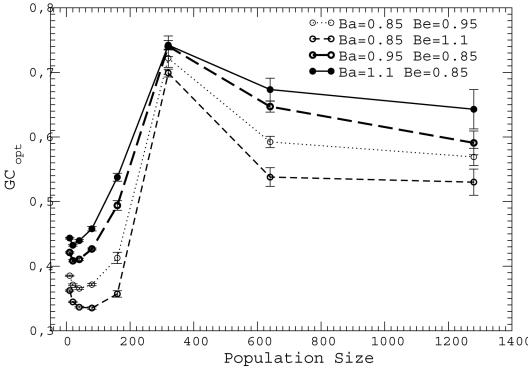
Figure 6. Optimal GC usage  versus population size
  for neutrality exponent
  and different values of the neutral thresholds
  and
and  , where the reference energy gap
  and unfolding free energy
  are those measured for the protein in the PDB.
We simulated all nine combinations of the values  for either
  of
of  . We only show four combinations since all other curves are contained between them.

