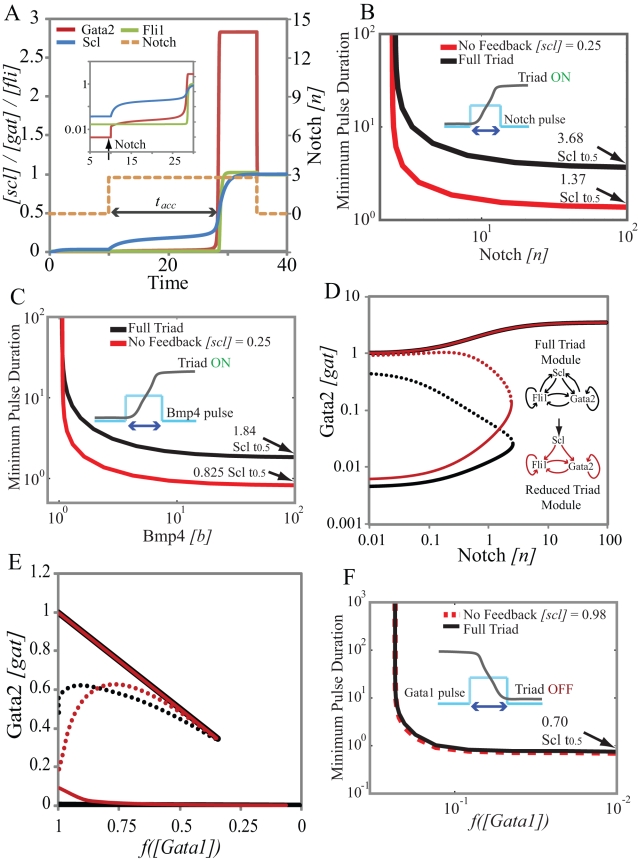
Figure 4. Comparison of dynamical responses of the triad and the reduced module to Notch, Bmp4 and Gata1 signals.
A. A time course of the switching from low expression to high expression state in response to a pulse of Notch. The inset shows that there is an increase in Gata2 concentration immediately after the introduction of Notch. Scl starts accumulating slowly in response to this increase in Gata2 concentration but Fli1 concentration is stagnant because enough Scl is not present to appreciably increase Fli1 expression. Once Scl has reached the required concentration (tacc after start of Notch pulse) Gata2 and Fli1 concentrations increase rapidly to the ON state level. Thus switching of the triad to the high expression ON state is rate-limited by the slow accumulation of Scl B. The minimum Notch pulse-duration required for OFF→ON switching as a function of pulse amplitude. Black line is the full triad the red curve is the reduced module with constitutive Scl (cf. text for details). C. Same as (B) but for Bmp signal. D. Steady-state response of the reduced module (red) with the Scl concentration fixed at the value that ensures that the switching threshold is identical to that of the wild-type triad (black). Note that the unsteady state (separatrix-dotted curves) for the reduced module is much closer to the ON state. E. Controlled comparison for deactivation by Gata1 steady-state response with Scl concentration fixed to ensure that the deactivation thresholds for both modules are identical. F. Transient filtering of Gata1 signals is very similar for the two designs since Scl does not limit the rate of response to Gata1.

