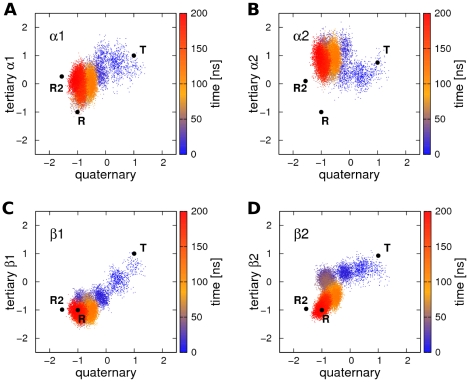
Figure 5. Tertiary versus quaternary transition during simulation T.HC3-3 (compare Figure 3C ).
Projection onto the quaternary transition vector connecting R and T X-ray structures (x-axis) is plotted versus the projection onto the tertiary transition vectors connecting the r and t structures of the (A) α1, (B) α2, (C), β1, and (D) β2 subunit. The projections were normalized such that −1 corresponds to the r/R state, and +1 to the t/T state. The color indicates the simulation time. The quaternary transition occurs simultaneously to the tertiary transition of the β subunits.

