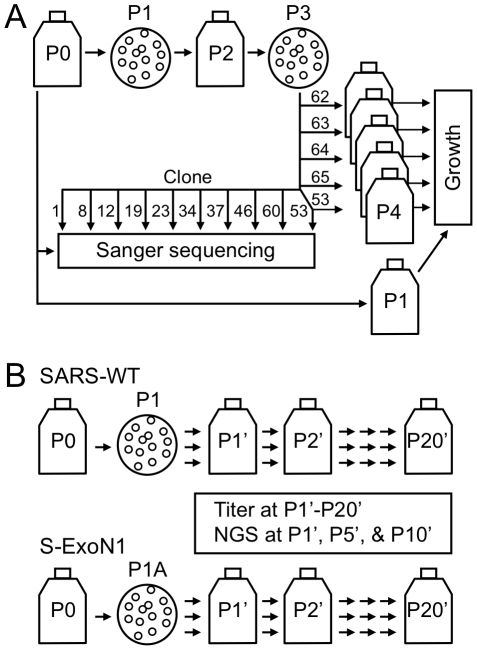
Figure 2. Virus isolation and passage strategy.
(A) The strategy used for plaque isolation and passage to obtain stocks used in dideoxy (Sanger) DNA sequencing and viral growth analyses. Flasks indicate population stocks, and circles indicate plaque isolation. A single Passage 1 (P1) plaque clone was the parent of all P3 clones used in complete genome sequence analysis (10 clones) or growth analysis (five clones). Clone numbers are shown. S-ExoN1 P3 clone 53 (c53) was used in both sequence and growth analyses. The scheme shown is for S-ExoN1 but an identical scheme was used for SARS-WT except that clone numbers were different and P3 c21 was used in both sequence and growth analyses. For sequencing, P3 plaque homogenates were expanded on fresh cells and total intracellular RNA was obtained (not shown). Genome sequences were defined as P3, whereas P4 viral stocks were used in growth analyses. (B) Serial population passage. Passage numbers in the serial population passage series are designated with a prime. Three clones of SARS-WT or S-ExoN1 were isolated at P1 or P1A, respectively, and passaged in parallel in the P1'-P20' series. Note that P1A in panel B and P1 in panel A are distinct plaque isolation experiments from the same P0 stock. Viral titers were determined at every passage in the P1'-P20' series and next-generation sequencing (NGS) was performed at P1', P5', and P10' for one clonal lineage each for SARS-WT and S-ExoN1.

