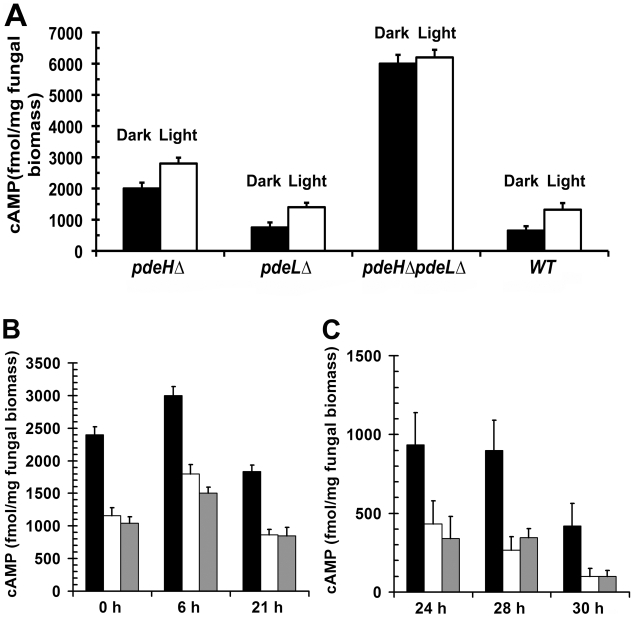
Figure 3. PdeH regulates the intracellular cAMP levels during growth and development in M. oryzae.
Bar graphs depicting the steady-state levels of cAMP prevalent in the pdeHΔ, pdeLΔ, pdeHΔ pdeLΔ and wild type during asexual development and pathogenesis. (A) Estimation of the cAMP levels in the indicated strains during asexual development (aerial hyphae, conidiophores and conidia). The indicated strains were initially incubated in the dark (black bar; non-conidiating) for 3 d, followed by exposure to light for 24 h (white bar; conidiating) prior to cAMP measurements. Values represent mean ± S.E from two independent experiments with two replicates each. (B) Conidia from the pdeHΔ (black bar), pdeLΔ (white bar) and wild type (gray bar) strains were inoculated on inductive surface of GelBond membranes and harvested at the indicated time points for cAMP estimations. The 0 h time point represents freshly harvested conidia, while 6 h to 21 h represents the early stage of pathogenic development. Values represent mean ± S.E from three independent experiments with three replicates each. (C) The steady-state levels of cAMP were also quantified from conidia inoculated on inductive surfaces for 24, 28, or 30 h representing the late stages of pathogenic development. Values represent mean ± S.E from three separate experiments with three replicates each.

