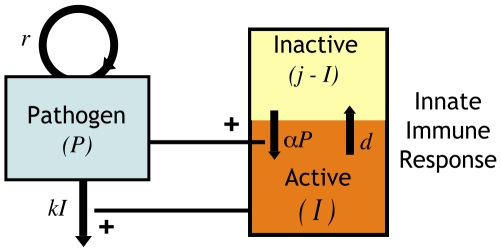
Figure 1. Schematic of model.
In our model the density of the parasite,  , depends on two factors – its own replication (at rate
  ) and its clearance by activated innate immune cells
  at rate
  . The total number of innate immune cells equals
  and they can be either in a resting or activated state. Since
  is the number of activated cells, the number of resting cells equals
  . Resting innate immune cells are activated at rate
  , and revert back to the inactive state at exponential rate
  .
.

