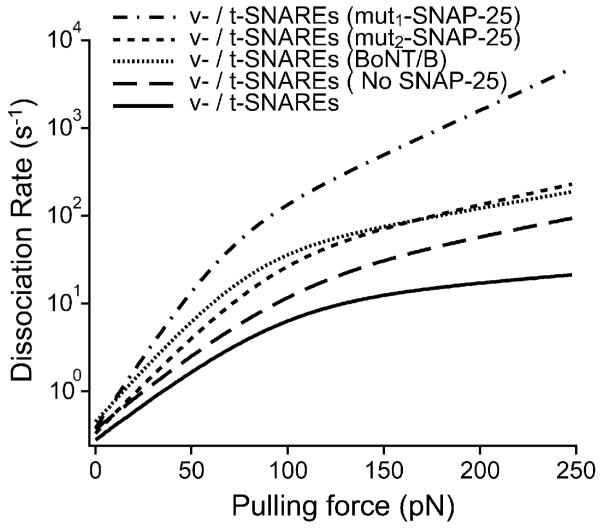
Fig. 6.
The kinetic profile for the dissociation of the SNARE complex reveals increased dissociation kinetics pursuant to SNARE perturbations. Based on the energy barrier parameters under the different experimental conditions (Table 1), the overall dissociation rate () of the SNARE complex was derived using eqn (3). The slope of the kinetic profile reflects the dissociation kinetics of the complex; a steeper profile indicates fast dissociation kinetics and a weak interaction. Thus, the native v-/t-SNARE complex has the slowest dissociation kinetics which corresponds to a strong binding interaction. The minimal change in the dissociation rate of the SNARE complex above ~100 pN, where the inner energy barrier dominates the SNARE dissociation process indicates that the inner barrier chiefly determines the mechanical strength of the SNARE binding interaction.

