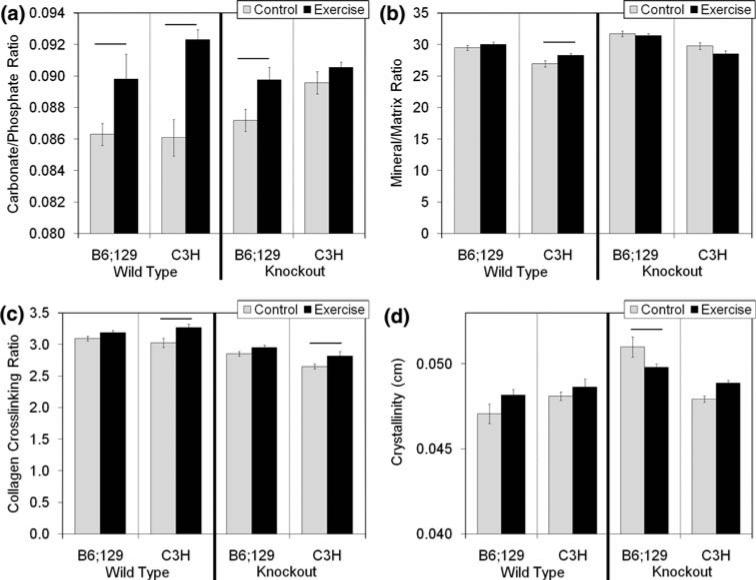
FIGURE 3.
Carbonate/phosphate ratio (a, indication of carbonate substituting for phosphate in the crystal lattice), mineral/matrix ratio (b, indicative of the relative amount of mineral), collagen crosslinking ratio (c, indicative of the ratio of non-reducible to reducible crosslinking), and crystallinity (d, indicative of the size, shape, and perfection of mineral crystals) as measured by Raman spectroscopy. There was a significant increase in the carbonate/phosphate ratio with exercise in B6;129 (p = 0.034) and C3H (p < 0.001) wild type mice. In B6;129 bgn-deficient mice, there was a significant increase in carbonate/phosphate ratio with exercise (p = 0.012) which was inbred strain-specific. In C3H WT mice, there was a significant increase in mineral/matrix ratio vs. control mice (p = 0.030) which was inbred strain-specific. Inbred strain-specific increases in the collagen cross-linking ratio were present in both WT (p = 0.003) and KO (p = 0.024) C3H mice compared with control mice. Finally, there was an inbred strain specific decrease in crystallinity with exercise in B6;129 KO mice (p = 0.020). Data are presented as mean ± SEM.

