
Figure 3. Effects of NMU and MSC on the plasma melatonin concentrations and MTNR1A mRNA expression levels in mammary gland and liver.
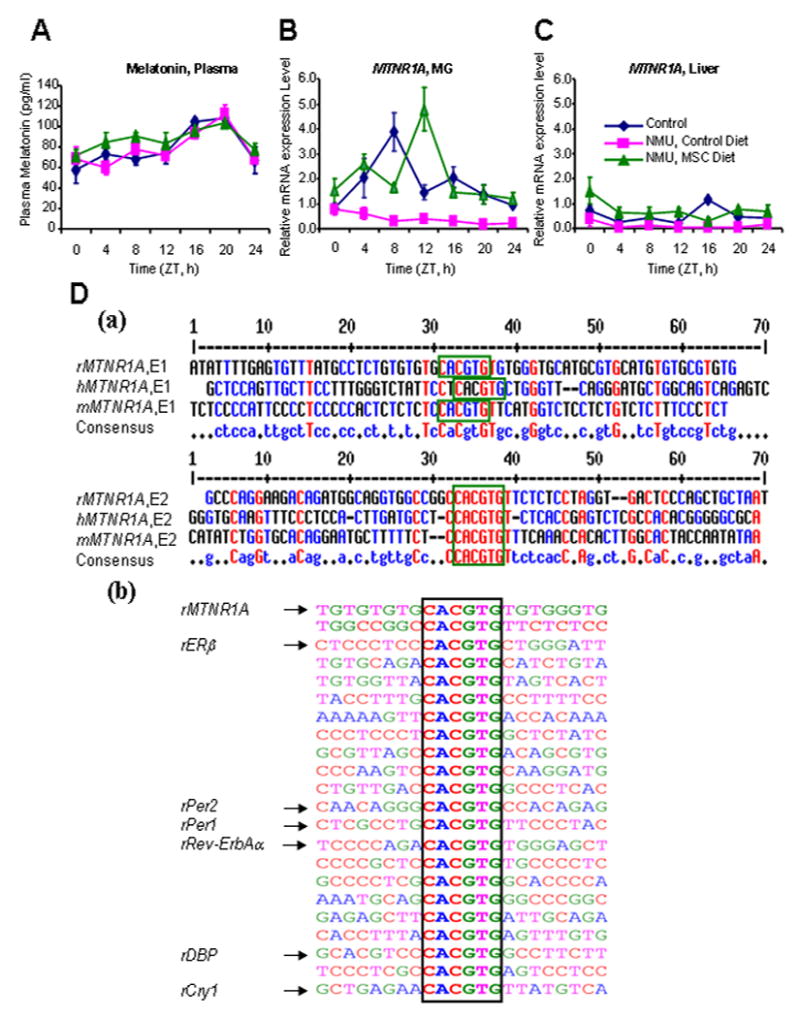
(A) Plasma melatonin levels were measured by ELISA in plasma samples of rats in different groups as described in Fig. 1 legend; (B and C) Relative mRNA expression levels were determined using quantitative real-time RT-PCR with total RNA samples from mammary gland (MG) (B) and liver tissues (C) of rats as described previously; (D) Conservation of Bmal1 E-box elements (framed) in the promoter regions of rat MTNR1A and circadian genes. The E-boxes within the 10-kb of 5’ up-stream, exon 1, and 2-kb of intron 1 region were analyzed. r, rat; m, mouse; h, human (a) Alignment of the proximal MTNR1A promoter regions from rat, mouse, and human. (b) Sequence comparison of the E-boxes found in MTNR1A promoter with those in the promoter regions of the indicated circadian genes in rat.