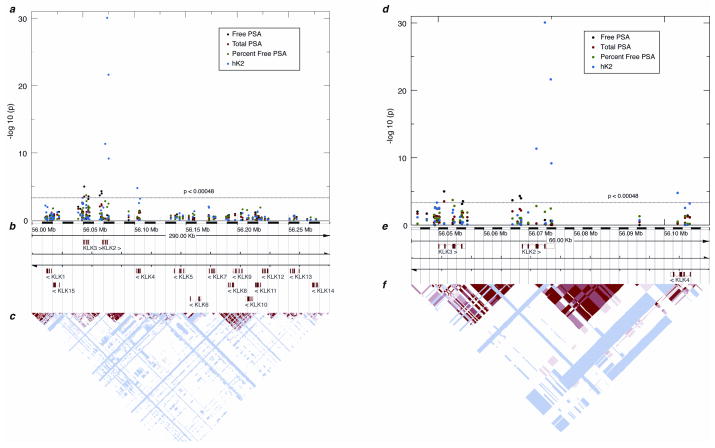
Figure 2.
Association of polymorphisms at the kallikrein locus with PSA forms and hK2 in plasma. A) Plot showing strength of association between SNPs and levels of free and total PSA, %fPSA, and hK2. A schematic of the kallikrein locus is below the plot, showing position and orientation of all 15 genes. B) Linkage disequilibrium plot from the CEU population in HapMap. Red indicates high LD as measured by D′. C, D) Similar plots as in A and B, but restricted to the KLK2 KLK3 region.

