
Table 1.
Inhibition of PLA2 by fluoroketones.a
| No | Structure | GVIA iPLA2 | GIVA cPLA2 | GV sPLA2 | ||
|---|---|---|---|---|---|---|
| % Inhibition | XI(50) | % Inhibition | XI(50) | % Inhibition | ||
| 2 | 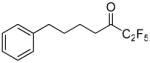 |
99.4 ± 0.1 | 0.0014 ± 0.0001 | N.D. | 28 ± 1 | |
| 6a | 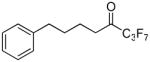 |
99.4 ± 0.0 | 0.0022 ± 0.0001 | 32.6 ± 4.0 | 61.8 ± 6.7 | |
| 6b | 98.4 ± 0.3 | 0.0030 ± 0.0002 | N.D. | N. D. | ||
| 19 | 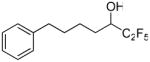 |
94.3 ± 1.5 | 0.0390 ± 0.0024 | 44.8 ± 3.7 | 67.3 ± 7.7 | |
| 20 | 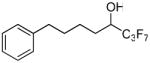 |
97.0 ± 1.3 | 0.0258 ± 0.0016 | 82.0 ± 1.2 | 65.8 ± 1.8 | |
| 10 | 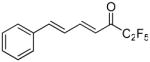 |
96.0 ± 0.8 | 0.0313 ± 0.0025 | 59.0 ± 3.6 | N. D. | |
| 12a | 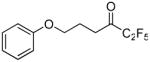 |
99.1 ± 0.5 | 0.0036 ± 0.0001 | N. D. | N. D. | |
| 12b | 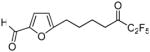 |
84.4 ± 2.1 | 0.0262 ± 0.0006 | N. D. | 41.9 ± 4.4 | |
| 21 | 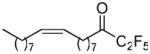 |
95.5 ± 0.4 | 0.0192 ± 0.0007 | 41.4 ± 3.4 | 67.0 ± 6.4 | |
| 22 | 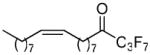 |
80.6 ± 2.5 | 0.0574 ± 0.0030 | 57.0 ± 1.9 | 33.9 ± 18.4 | |
| 23 | 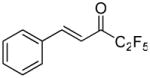 |
96.4 ± 0.6 | 0.0066 ± 0.0005 | N. D. | 76.9 ± 5.3 | |
| 12c |  |
98.3 ± 0.2 | 0.0084 ± 0.0006 | 76.1 ± 1.8 | 71.7 ± 3.6 | |
| 12d | 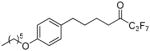 |
95.8 ± 1.3 | 0.0136 ± 0.0006 | 43.7 ± 3.2 | 76.9 ± 2.2 | |
| 12e | 99.4 ± 0.1 | 0.0029 ± 0.0001 | 91.5 ± 0.9 | 0.022 ± 0.001 | 61.4 ± 5.3 | |
| 12f | 99.4 ± 0.1 | 0.0024 ± 0.0001 | 88.8 ± 0.7 | 63.0 ± 6.2 | ||
| 12g | 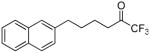 |
99.9 ± 0.1 | 0.0002 ± 0.0000 | 80.8 ± 1.5 | 36.8 ± 7.9 | |
| 12h | 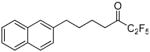 |
99.8 ± 0.0 | 0.0006 ± 0.0000 | 77.1 ± 1.8 | 58.4 ± 5.7 | |
| 12i | 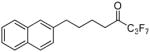 |
99.7 ± 0.2 | 0.0010 ± 0.0001 | 55.8 ± 2.1 | 46.3 ± 10.0 | |
| 18a | 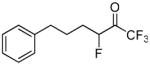 |
97.6 ± 0.2 | 0.0025 ± 0.0001 | 52.1 ± 2.2 | N. D. | |
| 18b | 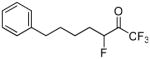 |
98.8 ± 0.2 | 0.0013 ± 0.0000 | 66.0 ± 3.7 | N. D. | |
| 24 |  |
100 ± 0.1 | 0.0005 ± 0.0000 | 68.4 ± 1.5 | 39.1 ± 12.6 | |
| 25 |  |
100.0 ± 0.1 | 0.0005 ± 0.0000 | 79.9 ± 1.0 | 36.1 ± 8.2 | |
a
Average percent inhibition and standard error (n=3) reported for each compound at 0.091 mole fraction. XI(50) values determined for inhibitors with greater than 90% inhibition. N.D. signifies compounds with less than 25% inhibition (or no detectable inhibition).