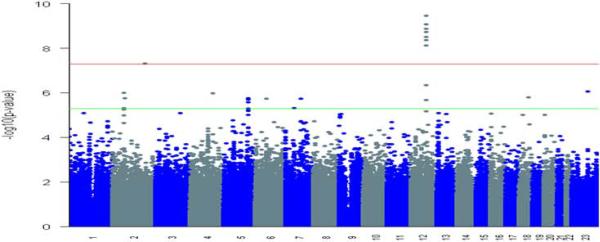
Figure 1. Genome wide association results plotted for 277 TGCT patients and 919 controls.
The threshold for genome wide significance was P < 5.0 × 10⁻⁸ (top red line) based on Fisher's exact test. Markers that reached significance at P < 5.0 × 10⁻⁶ (bottom green line) based on Fisher's exact test also were considered.

