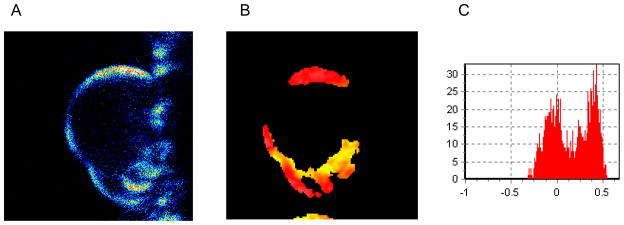
Figure 3.
Visualization of LPS distribution into DOPC:DPPC:FITC-LPS GUV’s (1:1:1 molar ratio) by two photon microscopy image at 25°C, that correspond to phase coexistence regions. A) FITC fluorescence on the surface of the GUV. B) LAURDAN generalized polarization (GP) image taken at the center of the same GUV. C) GP Histogram associated with the GP image (B). The FITC fluorescence seams to be localized in domains of the GUV (A), by GP LAURDAN image we determine that the domain where LPS localizes is a solid domain (B)

