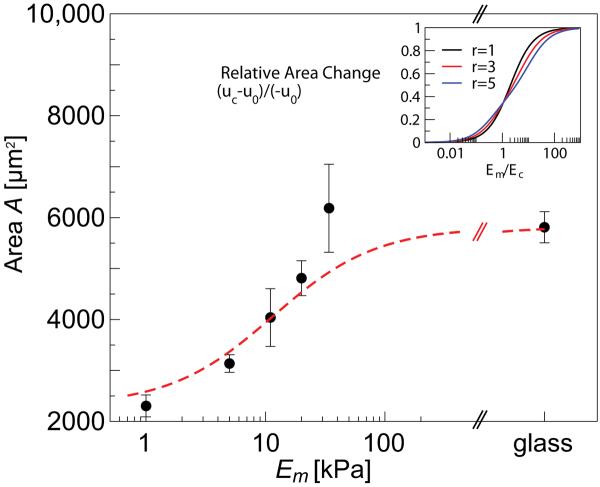
Figure 2.
Modulation of cell spreading area with matrix rigidity. Main panel shows a quantitative fit of the model Eq. 7 to our experimentally measured values for human mesenchymal stem cells; the fit was obtained with the value and did not include the point corresponding to Em = 34 kP a due to its large error. The inset shows how the modulation of cell area varies with the cell shape and the rigidity fraction, Em/Ec. This plot is for ηa = αv = αs = 0; cell and matrix Poisson ratios are νc = 0.3 and νm = 0.45 respectively. For finite values of αv and αs the cell area decreases. Finite values of spreading asymmetry, ηa (see Eq. 8 below), have only a small effect on these results.

