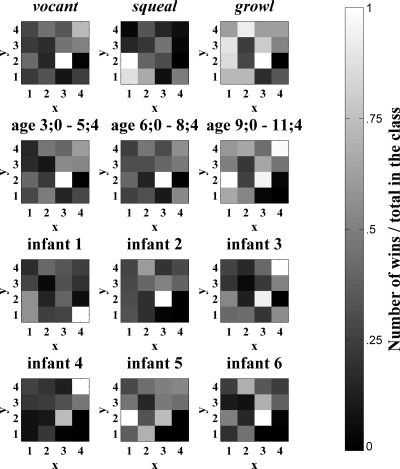
Figure 4.
Activations of the SOM layer by utterances with different protophone labels, produced at different ages, and produced by different infants. Bright indicates that a SOM node was often the winner and black indicates that a node was never the winner. Each 4×4 map corresponds to nodes of the SOM shown in Fig. 3. Note that the number of utterances belonging to each protophone category was not uniform; there were more vocants than squeals and more squeals than growls.

