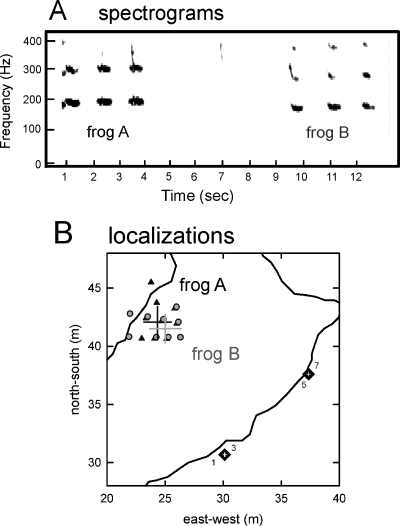
Figure 2.
Estimates of source locations for two bullfrogs belonging to the same cluster to illustrate the effective accuracy of localization. (A) Spectrograms to 400 Hz of three note advertisement calls produced by two individual male bullfrogs (frog A and frog B), calling sequentially over a 14 s time interval. For calculation of these and other spectrograms by ADOBE AUDITION, sounds were downsampled to 1500 Hz (Blackmann-Harris window, 512 frequency bands). The first harmonic frequencies of the notes in each bullfrog’s advertisement call differ (190 Hz for frog A and 170 Hz for frog B). (B) Localization estimates derived from calls in A. The black square∕white cross symbols outside the pond’s outline show the locations of the two sensors. The active microphones (1, 3 and 5, 7) in each sensor are indicated. The symbols inside the pond outline show the points of vector intersection computed from the advertisement call notes of each individual male. Estimates for frog A are indicated by the black triangles, and estimates for frog B are indicated by the gray circles. The localization program provided 20 intersection points for the three notes emitted by frog A, and 28 intersection points for the three notes emitted by frog B. Although all of these points are plotted, not all are visible because many of their locations overlap. Variability is indicated by black and gray crossed lines for standard deviations in the east-west and north-south dimensions calculated from all location estimates for frog A and frog B, respectively. The intersection points of each cross designate the mean locations calculated from the intersection points for the two frogs. Frog A and frog B are separated by a mean diagonal distance of 1.68 m. The maximum dispersion between all intersection points for these two frogs, excluding the points outside the pond, is 3.5 m. Dispersion is due largely to effects of reverberation on each localization estimate.

