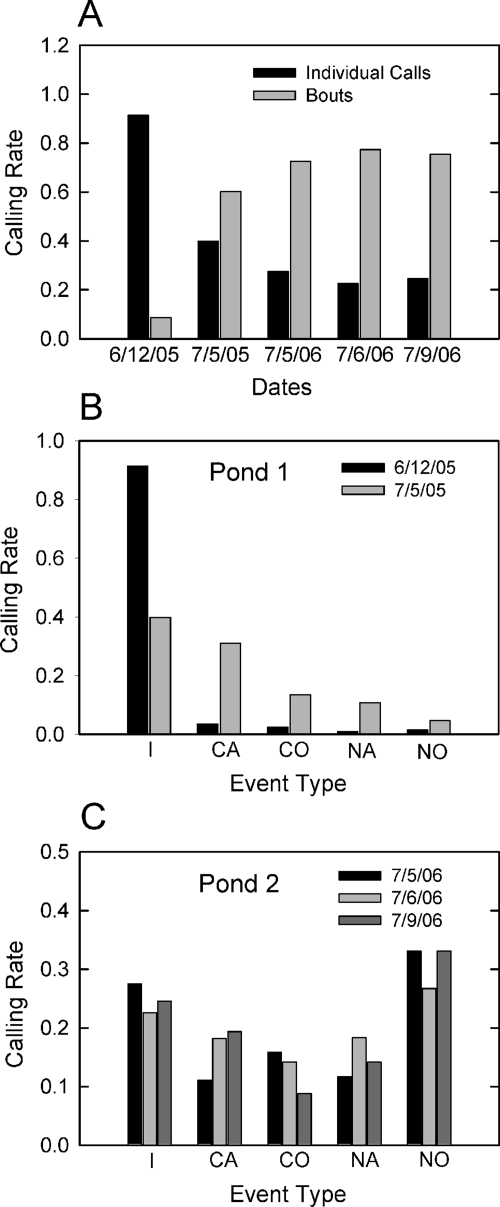
Figure 4.
Calling rates (normalized for the total numbers of calling events per night) at the two different chorusing sites. (A) Rate (y axis) of individual calls (black bars) and multiple frog interactions (bouts; gray bars) across all five nights (x axis) of chorus activity. The rate of multiple frog bouts was significantly higher in July than in June. (B) Rate of calling events at pond 1 on 6∕12∕05 (black bars) and 7∕5∕05 (gray bars). I=individual call; CA=call alternation; CO=call overlap; NA=note alternation; NO=note overlap. (C) Rate of calling events at pond 2 on 7∕5∕06 (black bars), 7∕6∕06 (gray bars), and 7∕9∕06 (dark gray bars). Note overlap was the most common type of multiple frog interaction on all three nights, but there were many instances of all types of calls and variability between the three nights.

