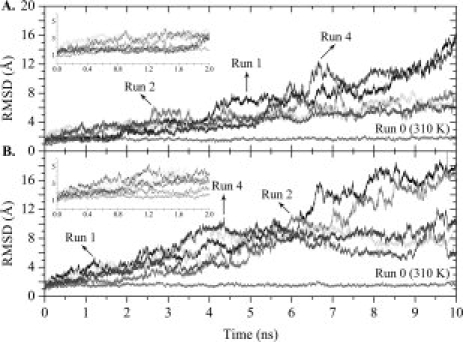
Figure 2.

Variation along the simulation trajectories of the Cα atom root mean square deviation (RMSD) with respect to the crystal structure. RMSDs were calculated over all residues except the N- and C-terminal tails. Control trajectories performed at 310 K are labelled accordingly. Results for 2 × 5 unfolding simulations at 500 K for WT-TTR (A) and L55P-TTR (B) are presented. The insets represent expansions of the first 2 ns of simulation.
