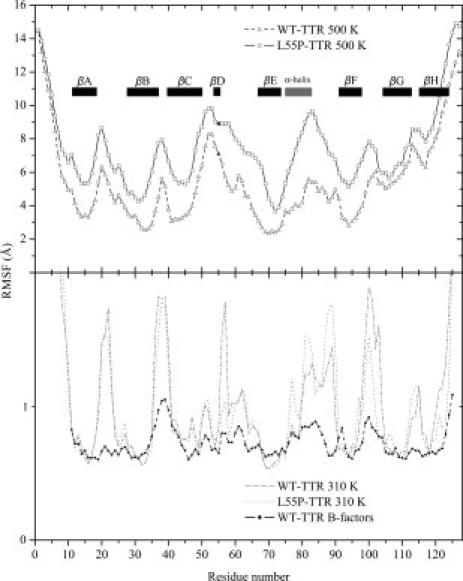
Figure 3.

Cα atom root mean square fluctuation (RMSF) as a function of residue number and calculated over all trajectories at 500 K (top panel) and 310 K (bottom panel) for WT-TTR (hollow triangles) and L55P-TTR (hollow squares). Residue 55 is colored in black. All 127 residues were considered and the secondary structure motifs are identified by eight black rectangles corresponding to the β-strands, and a gray rectangle corresponding to the α-helix. The line with black circles (bottom panel) represents the fluctuations derived from the crystallographic B-factors of WT-TTR (PDB entry 2QGB). For clarity, RMSF values in the top and bottom panels were represented with different scales.
