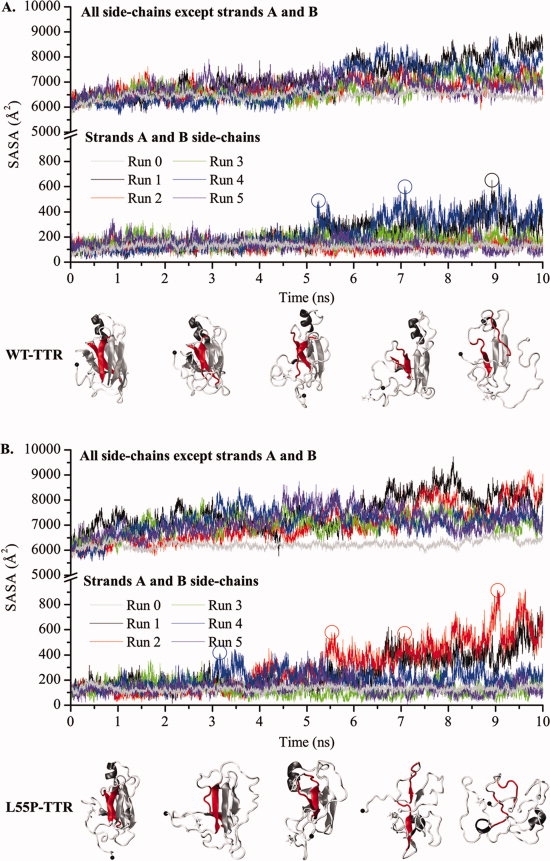
Figure 4.

Variation of the solvent accessible surface area (SASA) of the monomers' side-chains along MD simulations of WT-TTR (A) and L55P-TTR (B). The SASA of residues located in β-strands A and B (lower panels) and of all other residues (upper panels) are represented separately. Runs 0 are control simulations performed at 310 K. All other simulations are unfolding simulations performed at 500 K. Protein conformations shown underneath the plots correspond to SASA increases at different stages of the simulations. Strands A and B are highlighted in red.
