
Figure 5.
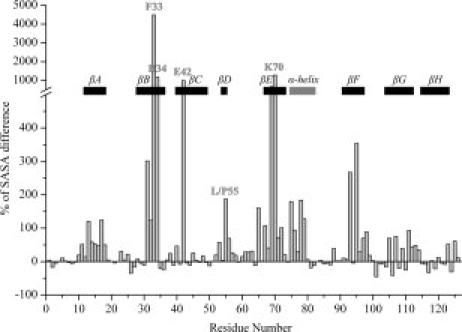
Relative difference in SASA per residue (% of SASA difference) between L55P-TTR and WT-TTR, across all sampled conformations. The secondary structure motifs in native TTR are identified by eight black rectangles corresponding to the beta-strands, and a gray rectangle corresponding to the alpha-helix. Additionally, residue 55 and all other residues displaying exceptionally high SASA increases are labeled.