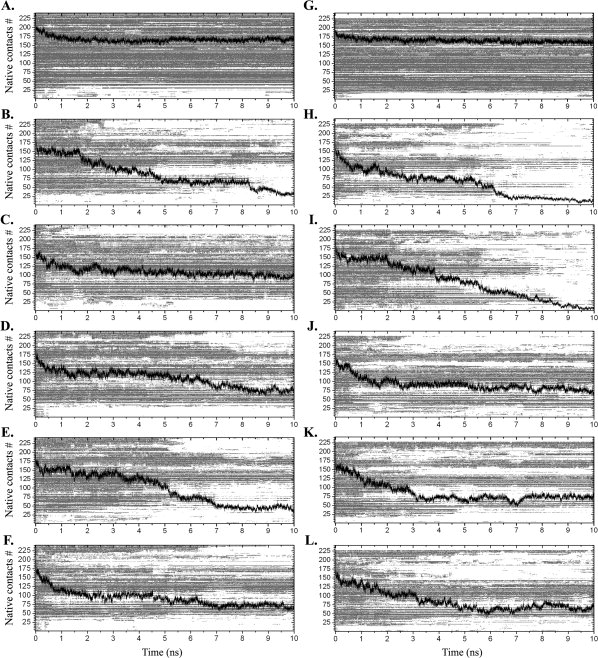
Figure 7.

Persistence of native contacts along MD simulations of WT-TTR (on the left) and L55P-TTR (on the right), for the control runs at 310 K (panels A and G) and for unfolding runs 1 to 5, at 500 K (panels B–F and H–L). Black traces represent the total number of enduring native contacts along the simulations. The light gray matrices on the background illustrate the persistence of each contact along the simulation.
