
Figure 8.
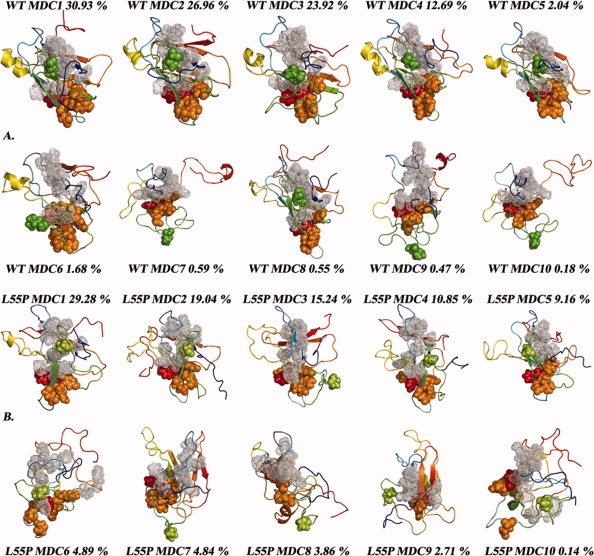
Minimum distance conformations (MDC) for each of the 10 clusters obtained by hierarchical agglomerative clustering for WT-TTR (A) and L55P-TTR (B). The residue at the mutation site is represented with spheres: Leu55 is colored in green and Pro55 in light green. Residues undergoing larger increases in SASA throughout the L55P-TTR simulations are represented as orange spheres; Phe33—showing the highest increase — is represented in red. Residues belonging to β-strands A and B and displaying significant increases in SASA are represented with gray dots. The orientation of all models was obtained by least-squares fitting to the initial crystal model of WT-TTR shown in Figure 1, except MDCs 7 and 9 which are slightly rotated from the other conformations.