
Figure 3.
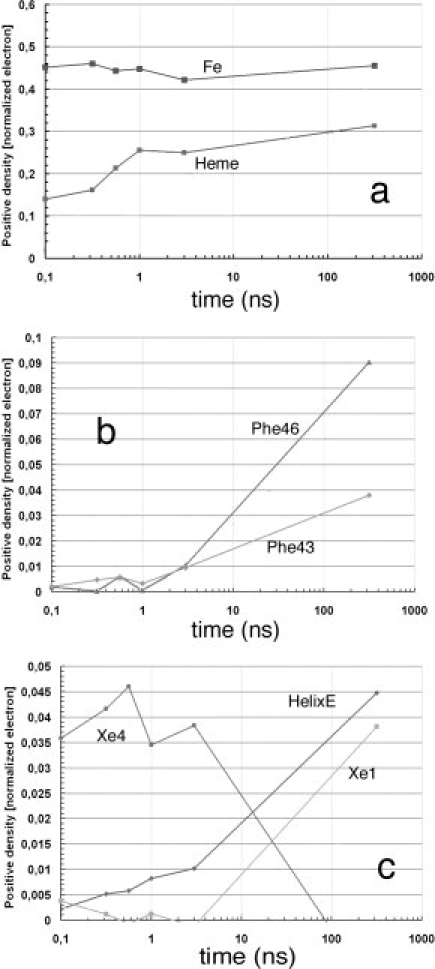
Time dependence of difference electron densities for key structural features, after photolysis of YQR-MbCO. Numerical values represent the integral of the positive electron density beyond 3.0 σ, corrected for variations in photolysis yield and normalized to the negative bound CO feature (arbitrary value of 1). (a) Key features that appear promptly: the density of the Fe popping out of the heme plane without delay remains time independent; while distortion of the heme (see Fig. 2) and motion of Tyr29 follow an heterogeneous time course being already detectable in the first frame (density of a 0.10–0.15 at 0.1 ns) but increasing with time. (b) Amino acid residues involved in the strain of the CD turn clearly lag behind the conformational changes of the heme and of Tyr29 on the distal side (see above). (c) Population of CO in the Xe1 and Xe4 pockets, and conformational changes of the E-helix: CO appears promptly after photolysis in the Xe4 pocket, on the distal side of the heme (with 0.035–0.045 density), and begins to diffuse inside and populate the Xe1 pocket on the proximal side starting from ∼5 ns. The migration of CO is approximately synchronous with larger scale conformational changes of the E-helix, suggesting that long-scale intramolecular diffusion demands more substantial structural changes of the globin. At much longer times (e.g., toward ms) CO rebinds largely via the opening of the His-gate,26 as shown by Scott et al.27 studying many different mutants of sperm whale Mb (from Bourgeois et al.,44 modified).