
Figure 1.
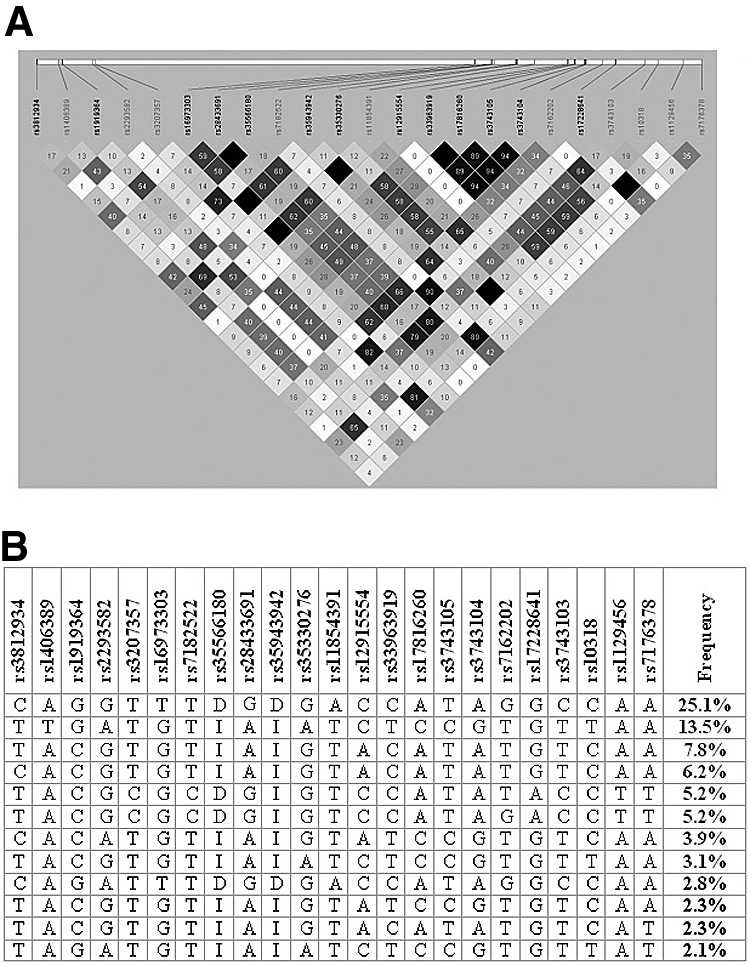
Linkage disequilibrium at the Grem1 locus. (a) Relationship between 23 biallelic SNPs resequenced in 48 control individuals from the Young Hearts collection. Pairwise comparisons where r2 = 0 (no correlation) are highlighted in white through a gray spectrum to black, where r2 = 1 (perfect correlation) for SNPs that are perfect proxies for each other. (b) Major haplotypes identified from snphap.