Figure 3.
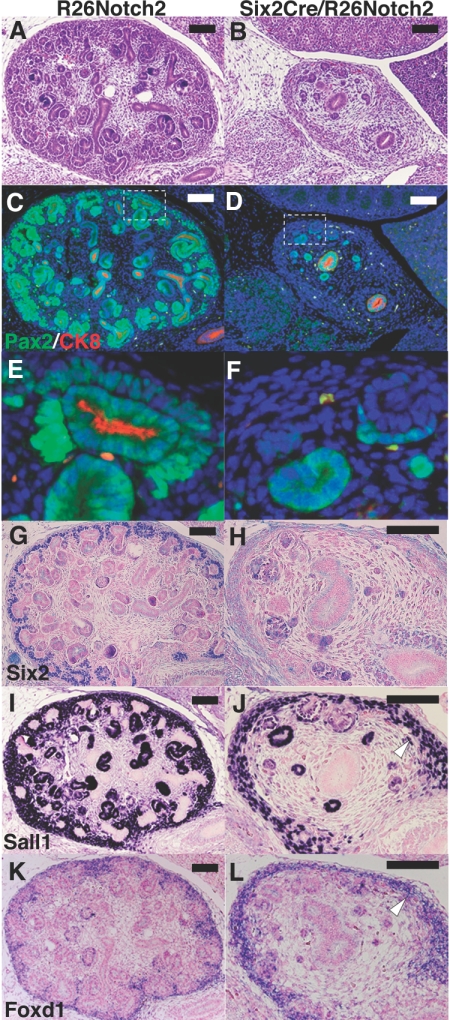
Notch2 overexpression causes nephron progenitor depletion. (A and B) HE staining at E14.5 during gestation. The mutant kidney is reduced in size and shows a thin cortical nephrogenic zone and poor nephron development, compared with the control kidney (R26Notch2). (C and D) Immunostaining for Pax2 (green) and cytokeratin 8 (CK8; red). (E and F) Higher-magnification images of the dotted square regions in panels C and D. They are ×6 of the panels C and D. Pax2-positive/cytokeratin-negative cells (arrowhead) that surround the ureteric bud-derived epithelia (arrow) are missing in the mutant cortex. Ureteric branching is also impaired. (G and H) Six2 immunostaining is significantly reduced in the mutant cortex. (I and J) Immunostaining of Sall1. Mesenchymal expression of Sall1 is reduced in the mutant kidney, whereas its stromal expression is retained (arrowhead). (K and L) In situ hybridization of Foxd1, a stromal marker. Foxd1 continues to be expressed in the mutant kidney (arrowhead). Scale bar = 100 μm.

