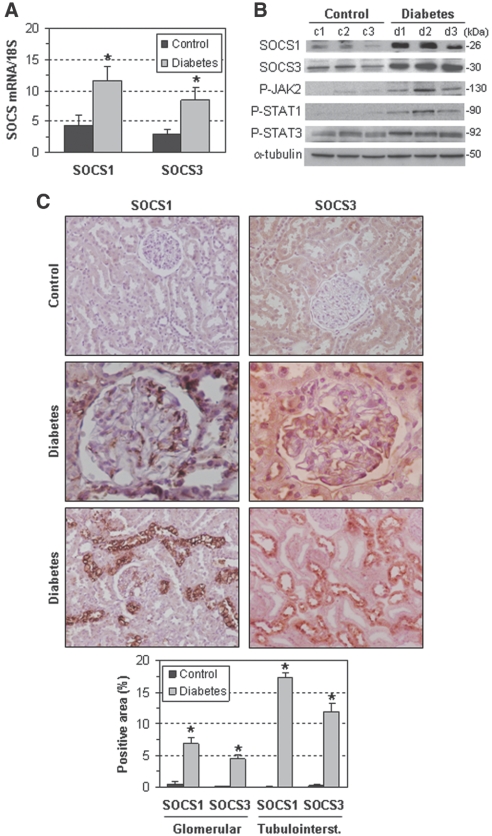
Figure 1.
Renal SOCS expression increases after diabetes induction in rats. (A) SOCS mRNA expression in renal samples from control and diabetic rats was determined by real-time PCR. (B) Representative Western blots for SOCS1, SOCS3, P-JAK2, P-STAT1, and P-STAT3 in control and diabetic rats. (C) Representative micrographs showing positive SOCS immunostaining in glomeruli (magnification: ×400) and tubulointerstitium (×200) of diabetic rats. Lower panel: Quantitative analysis data in control and diabetic groups. Data are mean ± SEM of three to five animals per group (*P < 0.05 versus control).

