Figure 4.
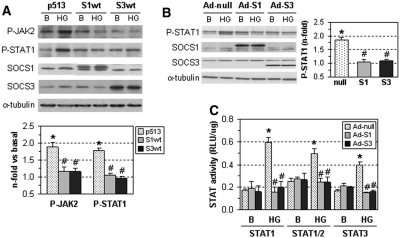
SOCS inhibit JAK/STAT activation by HG in renal cells. (A) Human MCs were transfected with SOCS expression vectors (S1wt and S3wt) or empty plasmid (p513). (B) Tubular HK2 cells were infected with SOCS-expressing adenovirus (Ad-S1, Ad-S3) or control adenovirus (Ad-null). After 24 hours, cells were stimulated for an additional 24 hours with HG. Representative immunoblots and densitometric analysis of the indicated proteins are shown. Fold increases versus basal conditions (10 mM d-glucose) are mean ± SEM of three independent experiments. (C) Adenovirus-treated HK2 cells were transfected with the STAT-responsive luciferase vectors and then stimulated for 24 hours with HG. Data of relative luciferase units (Firefly/Renilla/mg protein) are mean ± SEM of three to five experiments. *P < 0.05 versus basal, #P < 0.05 versus control (empty plasmid or Ad-null).

