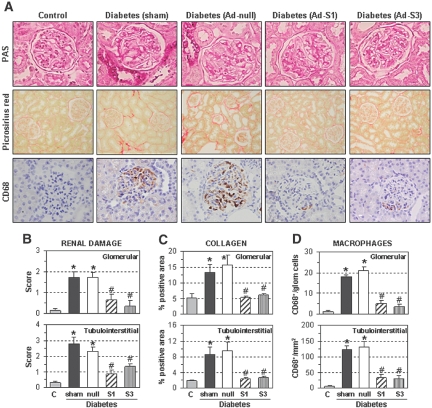
Figure 7.
SOCS gene delivery ameliorates diabetes-induced renal damage. Renal histopathology in control nondiabetic rats, diabetic rats without treatment (sham-operation), treated with control adenovirus (Ad-null), and with SOCS-expressing adenovirus (Ad-S1 and Ad-S3). (A) Representative micrographs of renal sections stained with periodic acid–Schiff (glomerular capillary dilation, mesangial expansion, and tubular glycogen deposits are observed; magnification: ×400), picrosirius red (collagen deposition; ×200), and CD68 antibody (macrophage marker; ×400). (B) Semiquantitative assessment of renal lesions (periodic acid–Schiff score: 0 to 3). (C) Quantification of collagen-positive areas. (D) Number of CD68+ macrophages in all of the study groups. Upper and lower panels represent measurements in glomerular and tubulointerstitial areas, respectively. Data are mean ± SEM of n = 12 rats analyzed per group (*P < 0.05 versus control nondiabetic rats, #P < 0.05 versus sham-operated diabetic rats).

