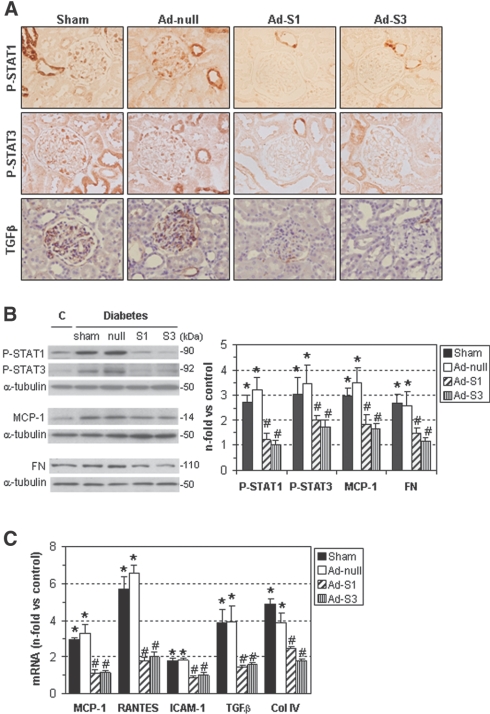
Figure 8.
SOCS gene delivery reduces STAT activation and expression of inflammatory and fibrotic genes in the diabetic kidney. (A) Representative micrographs of P-STAT1, P-STAT3, and TGFβ immunodetection in diabetic rat groups as specified. (B) Western blot analyses of P-STAT1, P-STAT3, MCP-1, and fibronectin (FN) levels in the renal cortex of control nondiabetic rats and STZ-induced diabetic rats (sham-operated, Ad-null, Ad-S1, and Ad-S3). Representative immunoblots and quantitative analyses are shown. (C) Real-time PCR analysis of the indicated genes in renal samples was assessed in duplicate and normalized by 18S endogenous control. Fold increases versus control rats are mean ± SEM (*P < 0.05 versus controls, #P < 0.05 versus sham-operated diabetic rats).

