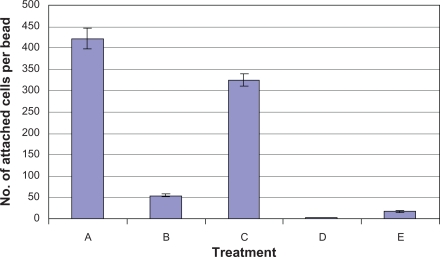
Figure 3b.
Statistical representation of treatments depicted in figure 3a. Cells bound to mannose/Ni+2-NTA agarose beads were counted using the Image Pro Plus software. Treatments: A) CSH50 host cells mixed with mannose agarose beads, B) CSH50(WM2XHis3) and C) CSH50(WMHis6) cultured in LBamp50 were mixed with Ni2+-NTA agarose beads for 1 h. D) same as C) followed by incubation with 0.5 M imidazole for 30 sec, E) CSH50(WM2XHis53) mixed with Ni2+-NTA agarose beads. The error bars represent standard deviation.

