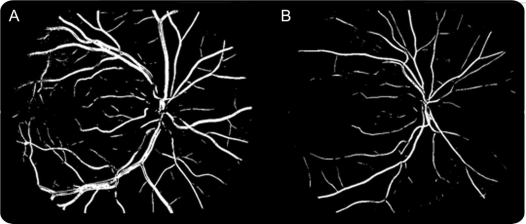
Figure 2 Segmented vessel maps of 2 retinal vascular trees
The image on the left (A) was the highest fractal dimension in this study (multifractal D0 1.736) and the image on the right (B) the lowest fractal dimension (multifractal D0 1.622). Note these images are segmented vessel maps for illustration purposes. We used the skeletonized images to actually perform the fractal analysis.

