Figure 2.
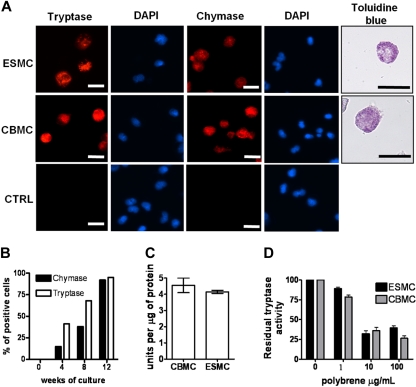
Phenotype of ES cell–derived mast cells. (A) Human mast cells differentiated from hES cells by EB formation were stained with antitryptase antibody, antichymase antibody, and Toluidine blue and compared with human mast cells derived from cord blood (CBMCs). Nuclei were stained with 4,6-diamidino-2-phenylindole. Figures were captured by an Olympus BX61 upright fluorescence microscope with 40× (antichymase, antitryptase staining) and 60× (Toluidine blue staining) objectives with a Hamamatsu ORCA RC camera, operated by Velocity software (PerkinElmer Life and Analytical Sciences). Bars in insets represent 10 μm. Controls represent cells stained without antitryptase, antichymase antibody. Figures represent 1 of at least 4 independent experiments. (B) Quantification of tryptase- and chymase-positive cells in culture during mast cell differentiation. (C) Activity of tryptase measured as a change in fluorescence activity of tosyl-Gly-Pro-Arg-pNA in mast cell lysates after 20-minute incubation at 37°C. Unit is defined as the amount of enzymatic activity that induces a 0.001 change in optical density at 405 nm/minute (n = 3). (D) Inhibition of tryptase activity by tryptase antagonist Polybrene, activity measured as in panel C (n = 3).

