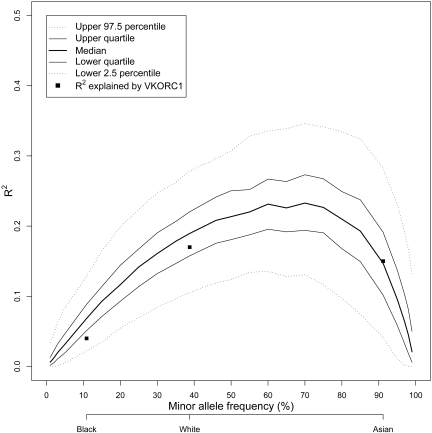
Figure 1.
Effect of VKORC1 −1639G>A minor allele frequency in explaining warfarin dose variability at the population level. Results of a simulation study showing the influence of the frequency of the A allele for −1639G>A on the amount of variance in warfarin dose explained (R2). Quartiles and upper and lower 2.5th percentiles of the distribution of R2 values from the simulation are plotted as a function of minor allele frequency. The highest variability in dose explained would occur in a population with an A allele frequency of approximately 60% to 70%. The actual R2 estimates for each racial group in the IWPC data are plotted as squares at the observed MAF for each group.

