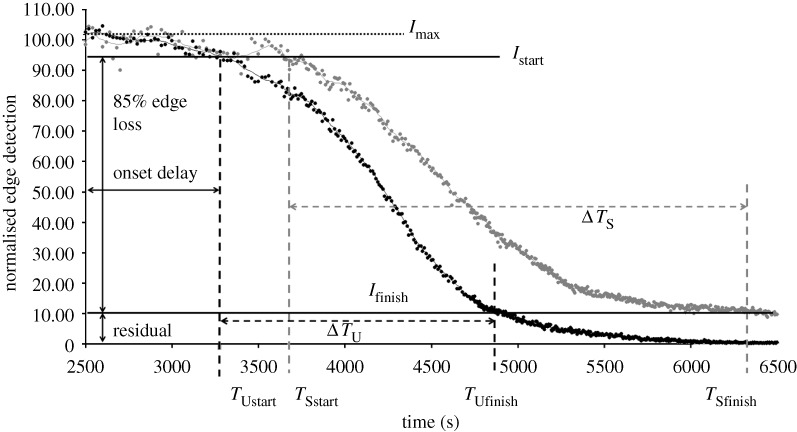
Figure 8.
Representative plot showing quantification of edge loss against digestion time ΔT, where Istart is 95 per cent of  (maximum edge detection), Ifinish is 10 per cent of
  and ΔT is the time (s) between. Multiple analyses were completed to consider differences in digestion time based on Istart and Ifinish of strained (S) and unstrained (U) fibrils. The residual strained fibril population that persists despite prolonged degradation is marked below 10 per cent
  . Grey line, strained; black line, unstrained.

