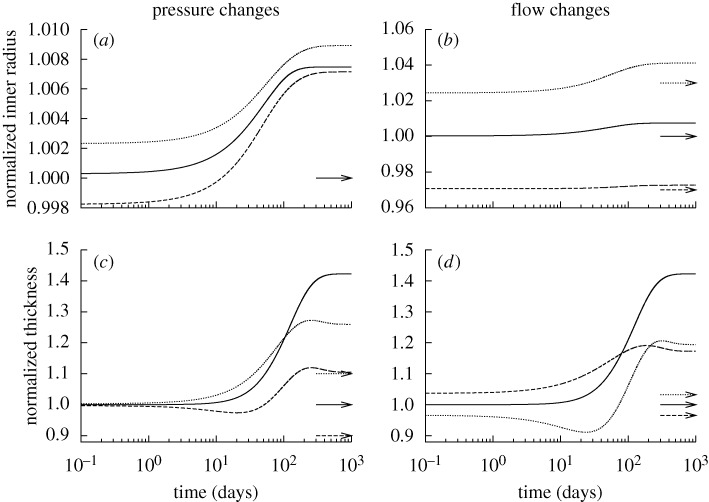
Figure 1.
Time courses of changing inner radius (a,b) and wall thickness (c,d) for changes in pressure (left) and flow (right) of −10% (dashed) and +10% (dotted) from the homeostatic value (solid) with  ∀s∈[0,1000] days. Expected values (cf. equation (4.1)) are indicated by corresponding arrows on the right ordinate. Although the vessel could neither maintain nor attain expected geometries, these changes stabilized asymptotically after long periods. Note the predicted large increase in wall thickness for all cases, suggesting the need for excessive deposition of sub-optimal material to compensate for the loss of the originally optimally deposited material. All quantities normalized with respect to homeostatic values at time s=0. These results can be compared to those in Valentín et al. (2009), which show ‘normal’ evolution towards expected values.

