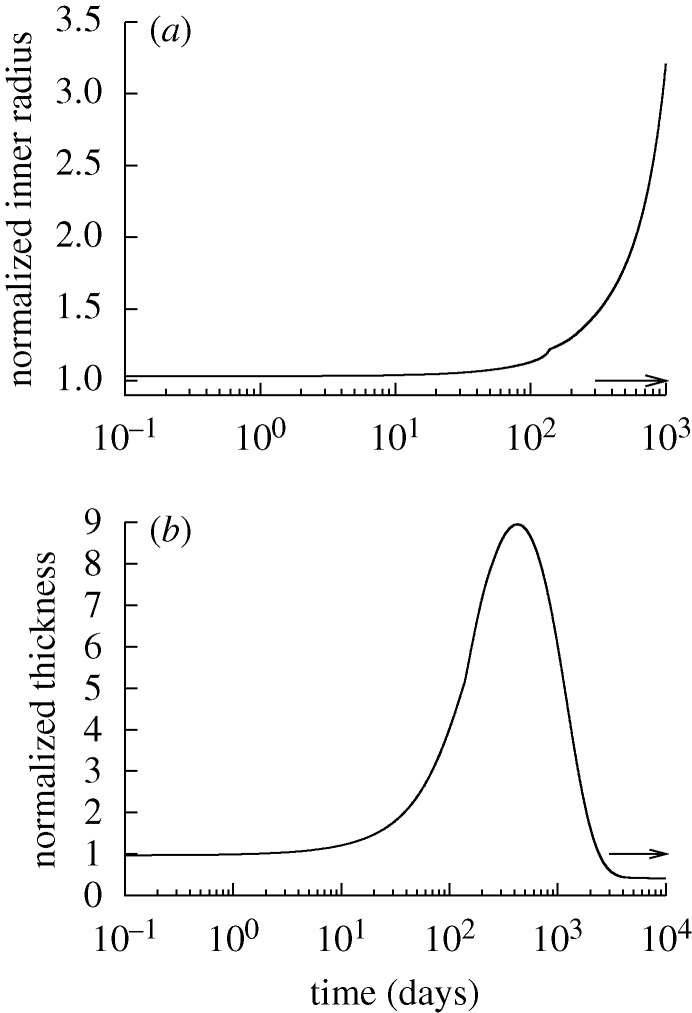
Figure 11.
Time courses of changing inner radius (a) and wall thickness (b) for the case of  and
and  kPa ∀s∈[0,10 000] days. Transmural pressure and flow are unchanged from homeostatic. Expected values (cf. equation (4.1)) are indicated by corresponding arrows on the right ordinate. The model predicts an unbounded monotonic increase in inner radius (shown only to 1000 days) and an initial increase, followed by a gradual decrease and eventual stabilization of wall thickness.

