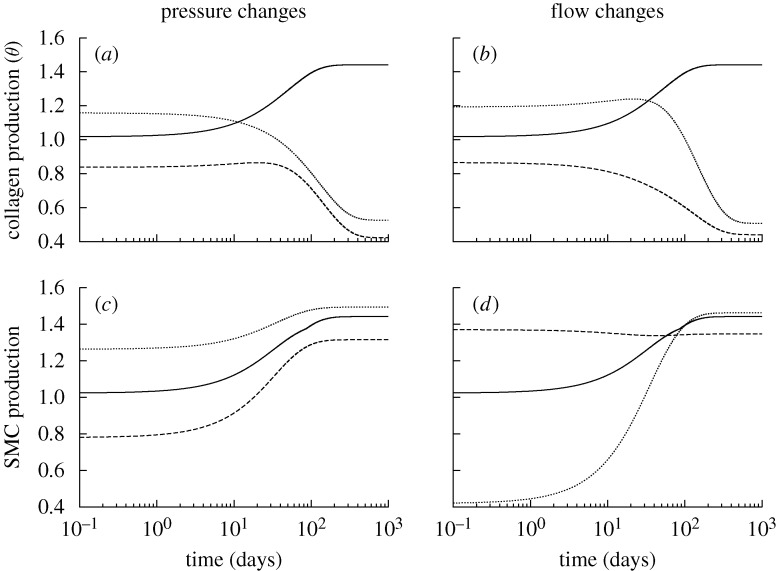
Figure 2.
Time courses of rates of mass density production for circumferential collagen (a,b) and smooth muscle (c,d), normalized with respect to homeostatic rates at s=0, for changes in pressure (left) and flow (right) of −10% (dashed) and +10% (dotted) from the homeostatic (solid) value where  days. Note the predicted large and sustained increases in smooth muscle production. SMC is smooth muscle cell.

